KnitPicker
Knitpicker is an app I made that helps knitters find the right project for their skill level. (Knitpicker is no longer live.)
What’s a knitting pattern and where do I get one?
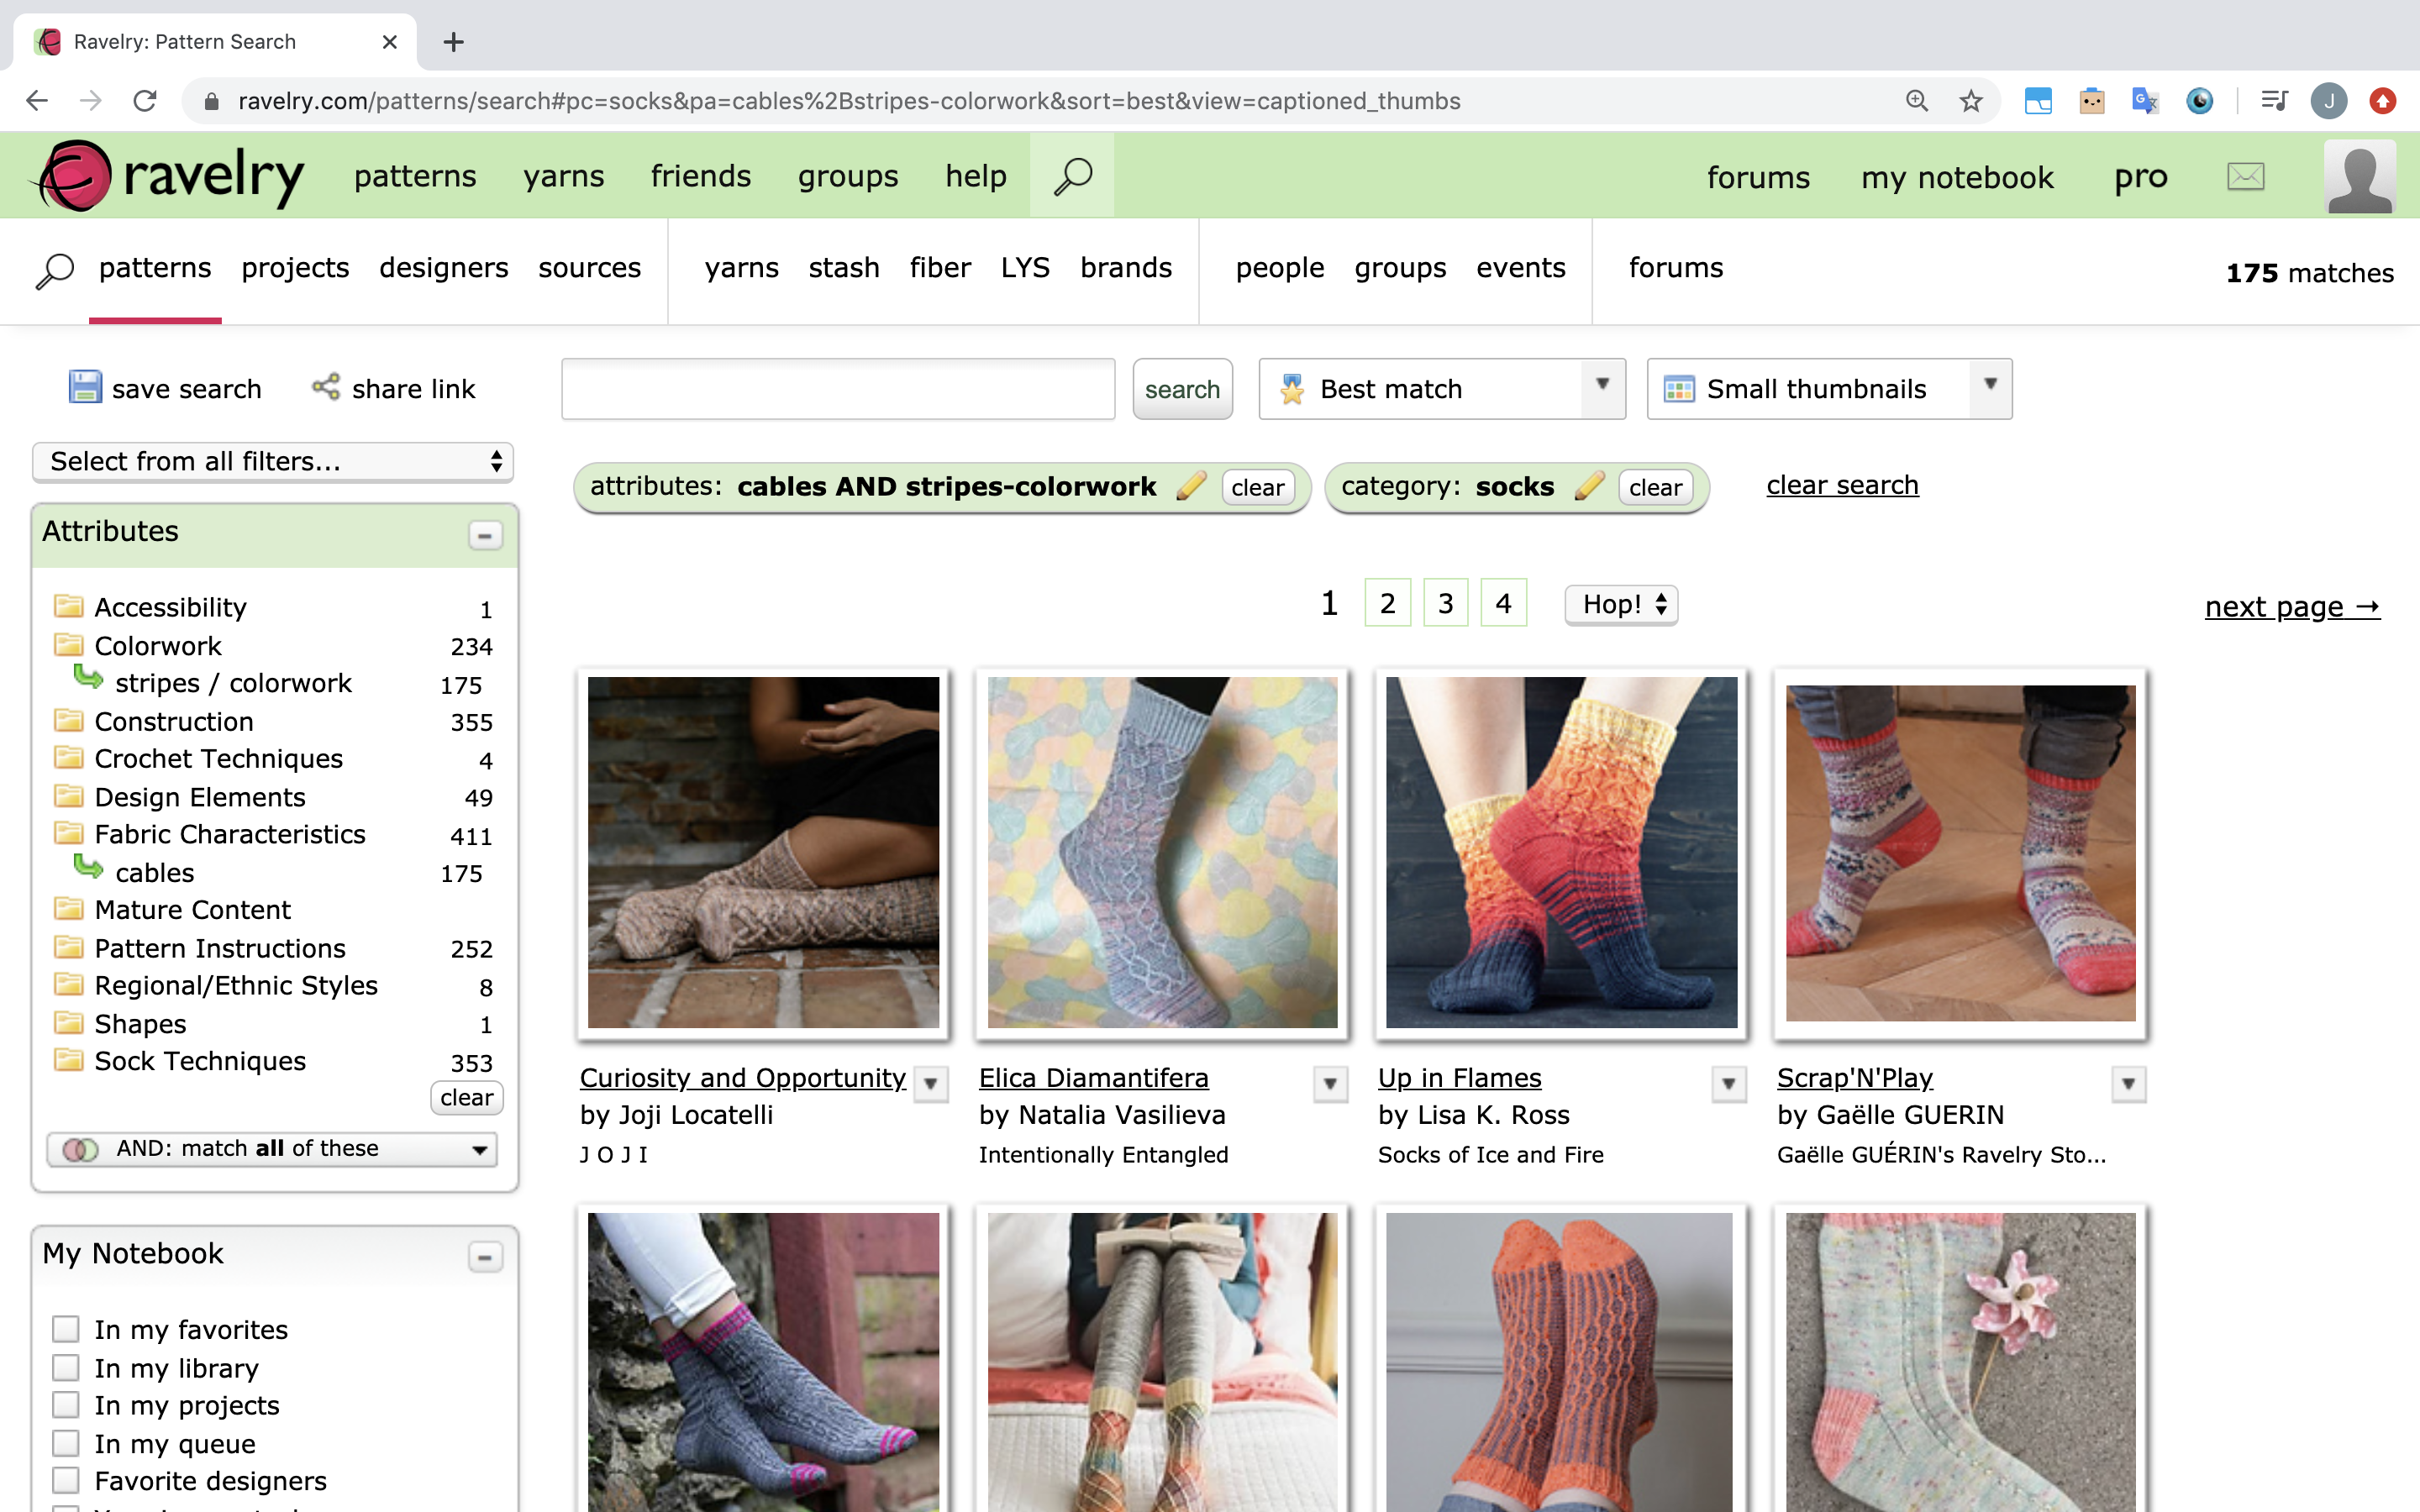
Ravelry is THE social media website for knitters and other yarn crafters—there really is no other site like it. Users go to Ravelry to buy and sell patterns, which are the instructions for making a knitted item. One of the site’s best features is its pattern browser where you can filter and sort through nearly a million patterns to find exactly what you want.
Knitters want to know how difficult patterns are
If you’ve ever tried out a new craft, you’ve probably known the frustration of starting an exciting new project, only to realize that it’s way beyond your current skill level. Knitters want to know how difficult a particular pattern will be—sometimes they want to learn a new skill and push themselves, and sometimes they just want to make something easy to relax. If users can’t tell how difficult a pattern will be, they might be less willing to buy a pattern; if a user has a bad experience with a pattern, they might even get turned off of the craft and the Ravelry platform altogether.
Ravelry does have a rating system where users can leave difficulty reviews on a scale from 1 to 10, but this information is not available for most patterns because not enough users have rated them. In fact 80% of patterns have fewer than 5 difficulty reviews each, which is not very useful for users.
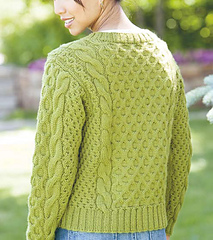
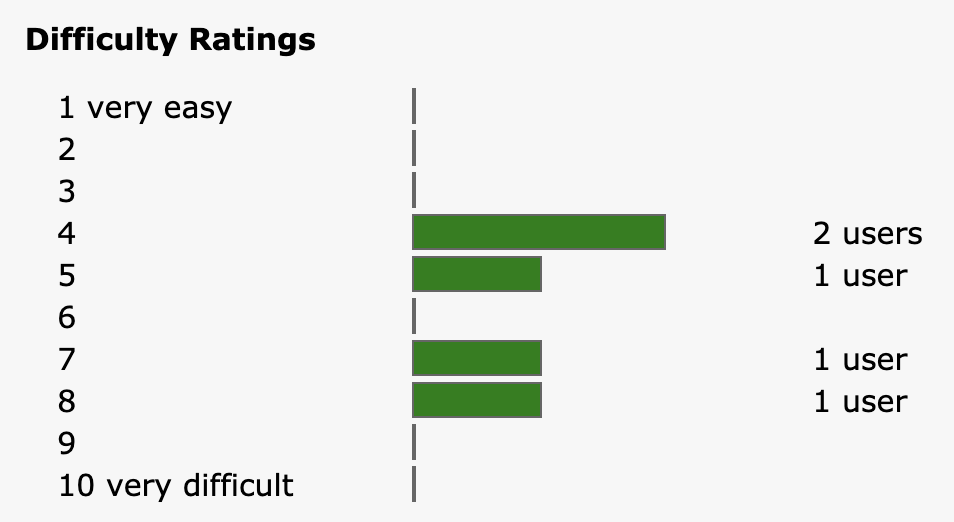
This pattern, Honeycomb V-Neck Pullover by Lily M. Chin, only has 5 difficulty reviews, which makes it hard to tell how difficult it will be for most users. 80% of Ravelry patterns have fewer than 5 difficulty reviews.
Knitpicker predicts pattern difficulty
On knitpicker, you can input a url to a Ravelry pattern page, and see a predition of how difficult that pattern is on Ravelry’s 1 to 10 scale.
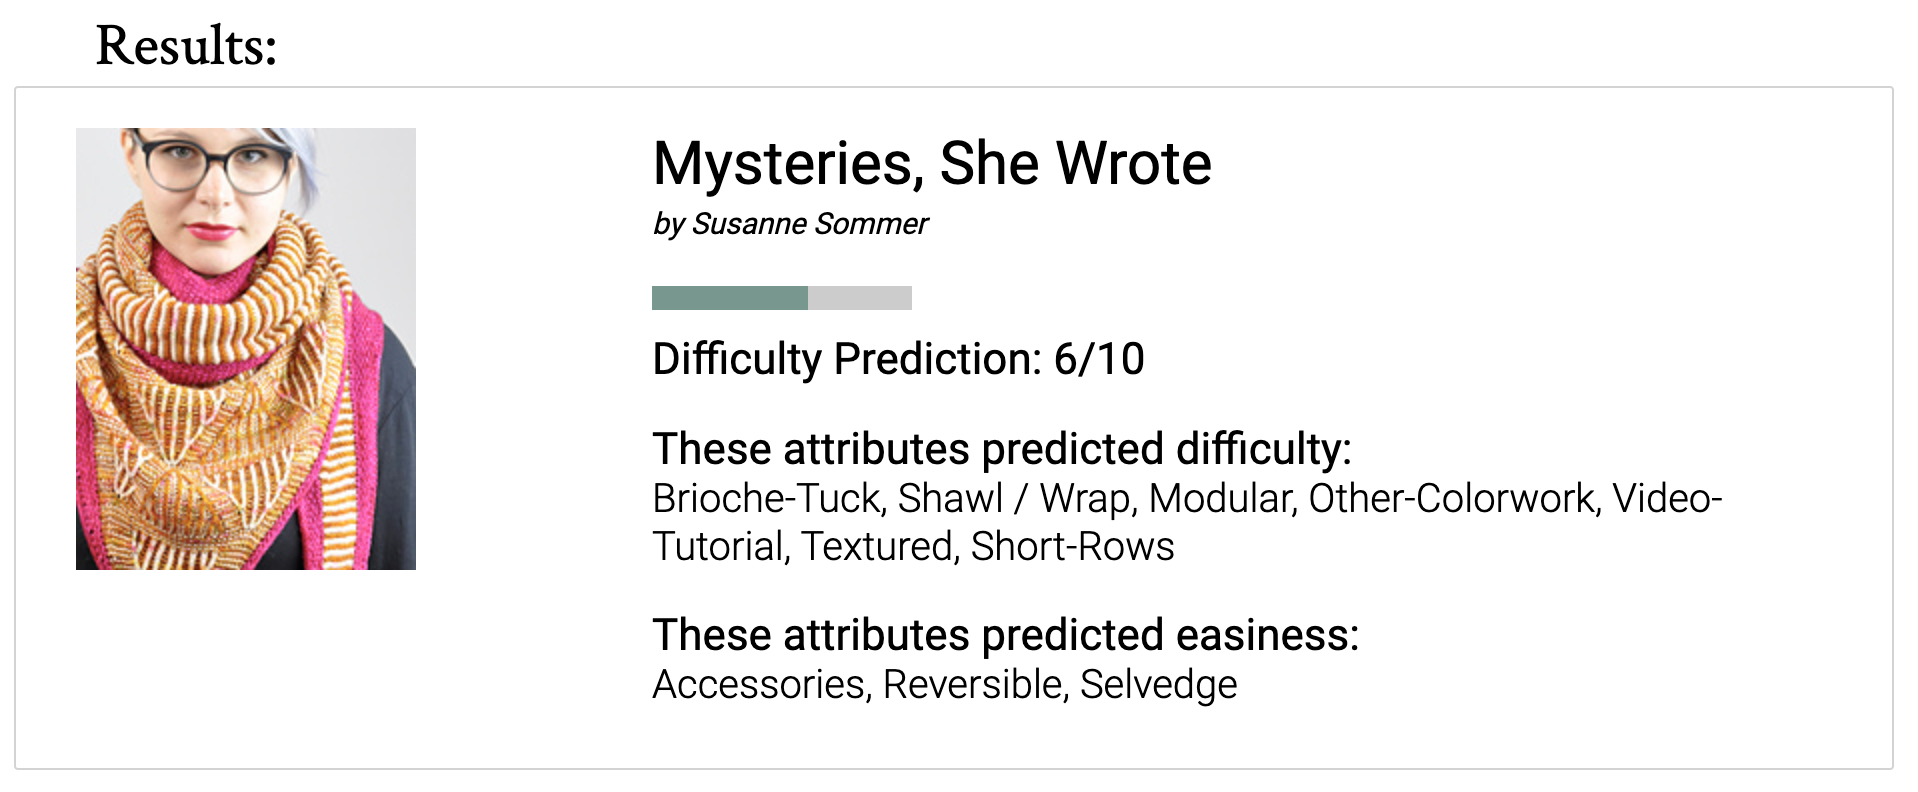
The app also helps the user interpret that prediction by showing the attributes that were predictive of more or less difficulty. For example, the app shows the term “Brioche” as something that makes this particular pattern difficult—brioche is an advanced knitting technique.
How it works
There are two pieces to the knitpicker app. First, I use a weighted linear regression model to produce a difficulty prediction for the pattern. Then I use feature importance to display the features that are most predictive of difficulty.
Features
For features, I used the descriptive text tags that are available as metadata on Ravelry’s pattern pages. These tags are words like “sweater” or “cables” that describe both what the pattern is and techniques you need to know to make it.
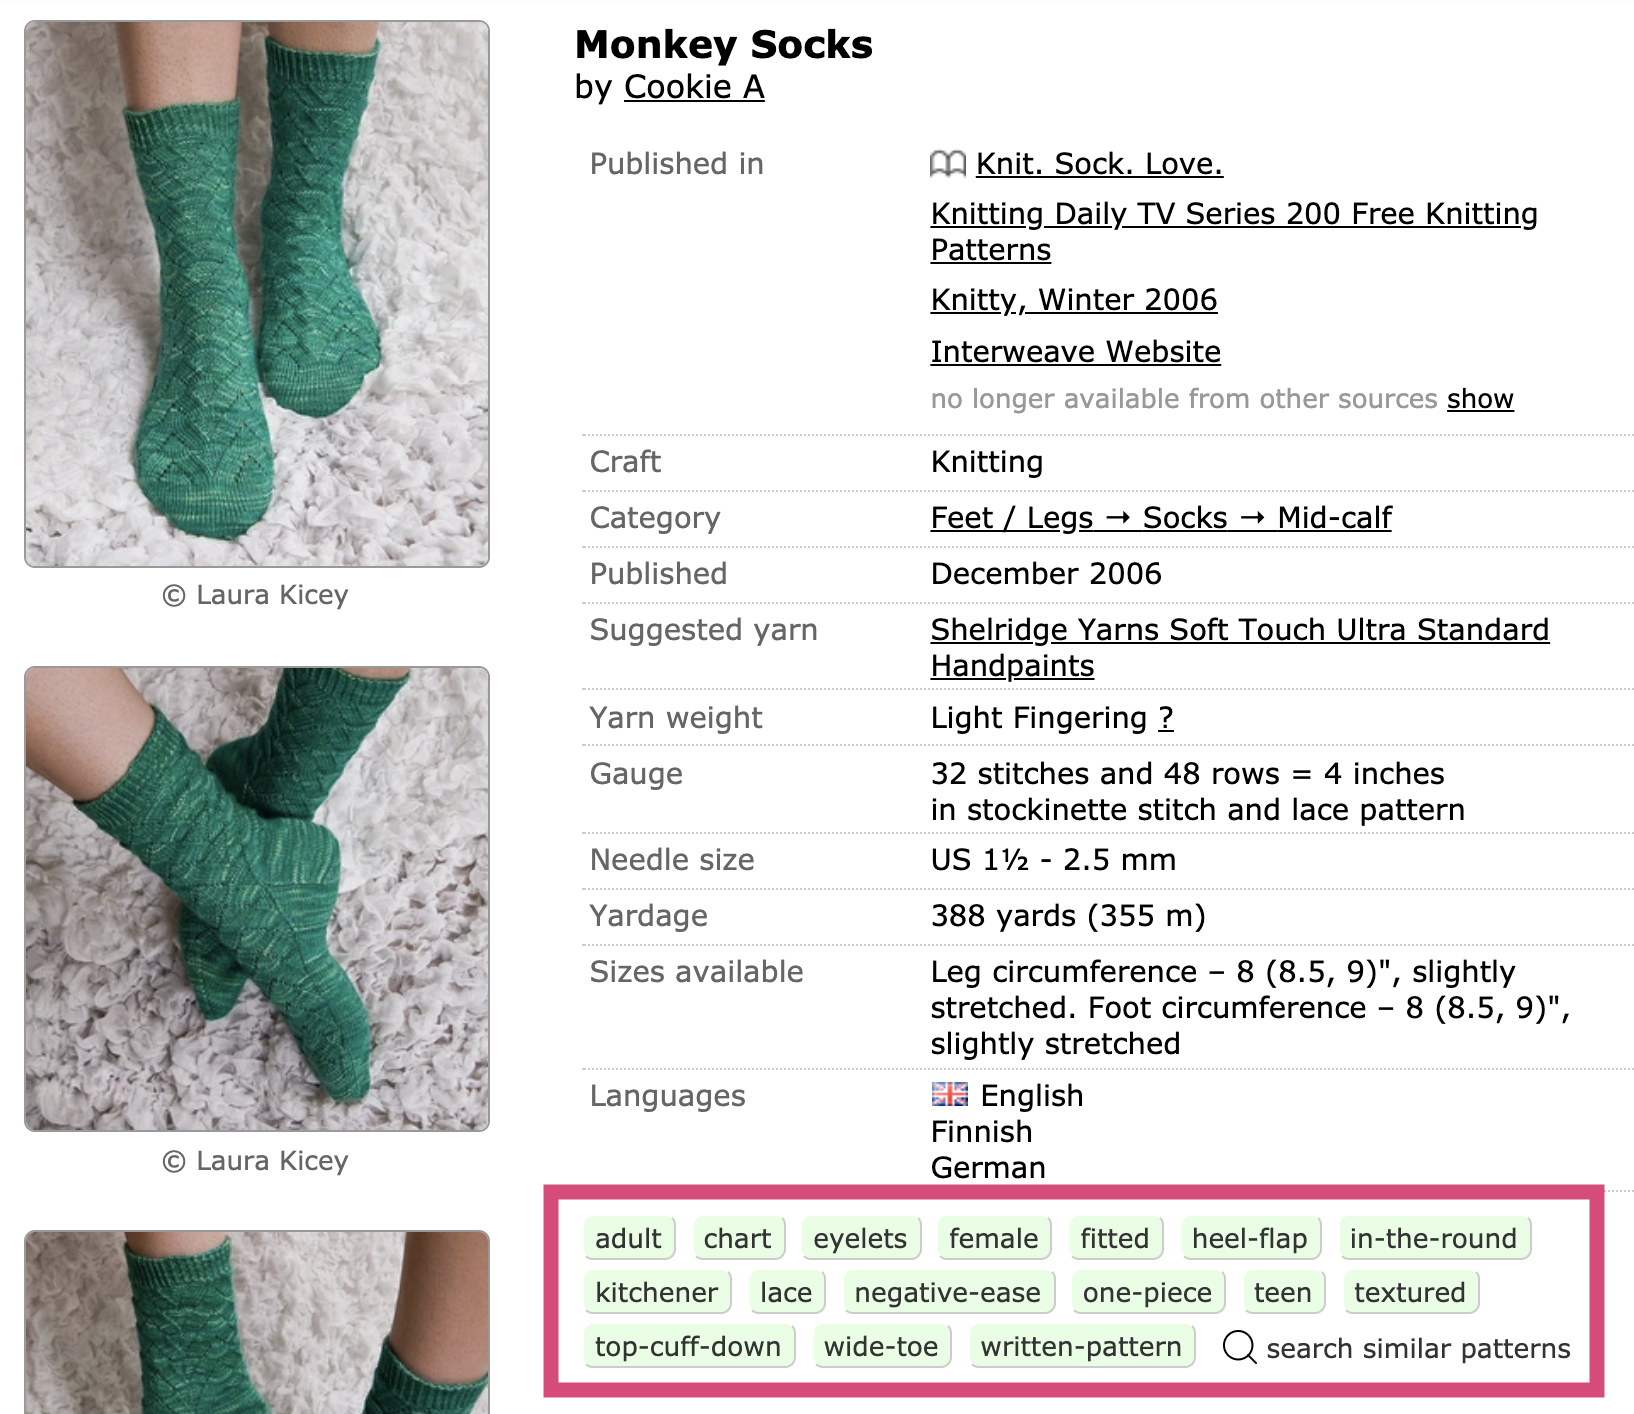
I used the text tags outlined in pink ("adult", "chart", etc.) as features in my difficulty prediction model.
I encoded these text-based features using bag of (unique) words. The downside of this encoding is that the model won’t be able to use tags it hasn’t seen before to make a new prediction, but since Ravelry has a finite set of tags, I was able to get most of them in my training set.
I tried adding another feature, needle size, to the model. Knitting is done with two knitting needles, and patterns typically suggest a narrow range of needle sizes to use when making the pattern. Both very small and very very large needles can be difficult to work with, so I thought this might provide additional difficulty information to the model. I didn’t see any accuracy improvements when using this feature, however, so in the end I stuck with just the text tags.
Labels
For each pattern, I used its mean difficulty rating as its label. I found 16 000 patterns that had more than 50 difficulty reviews each, and used these patterns as my training examples. (I use the small group of patterns with well-labeled difficulty values to train a model that can then predict difficulty for the rest of the poorly-labeled patterns.) Although Ravelry has patterns available for several different crafts, I looked only at knitting patterns for this project to keep things simple.
For this pattern, the mean difficulty rating is 3.
You might ask the question–Do users agree enough on pattern difficulty to make the average difficulty meaningful? I found that among my training examples, the mean of the standard deviation of each pattern’s difficulty ratings was 1.3 difficulty points, which shows us that most patterns do have a reasonable consensus on difficulty.
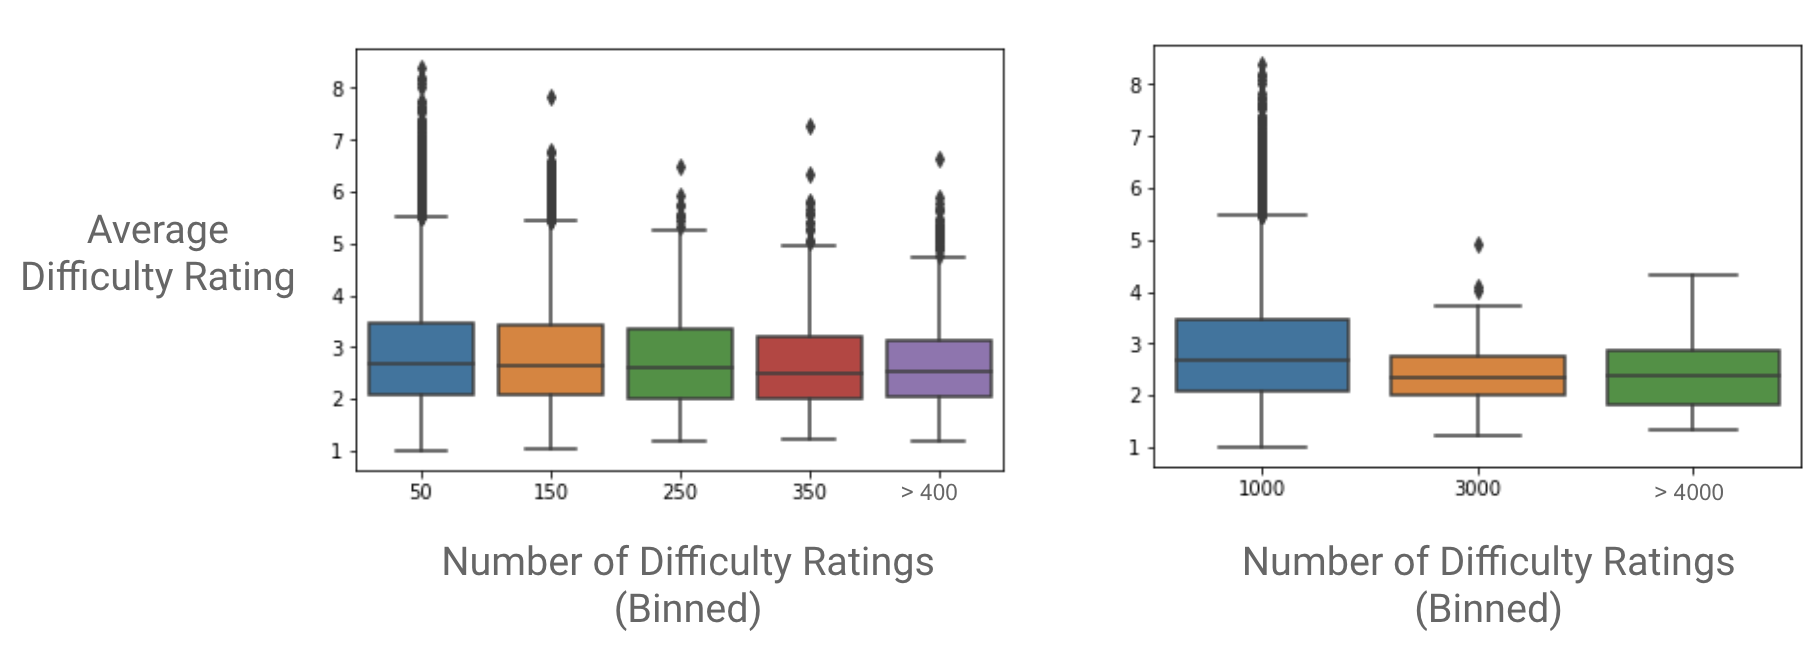
You might also wonder whether there is a bias towards having more difficult patterns in the training set, because maybe people tend to add more difficulty reviews when they struggle with a pattern. However, I found no correlation between number of difficulty ratings and average difficulty rating.
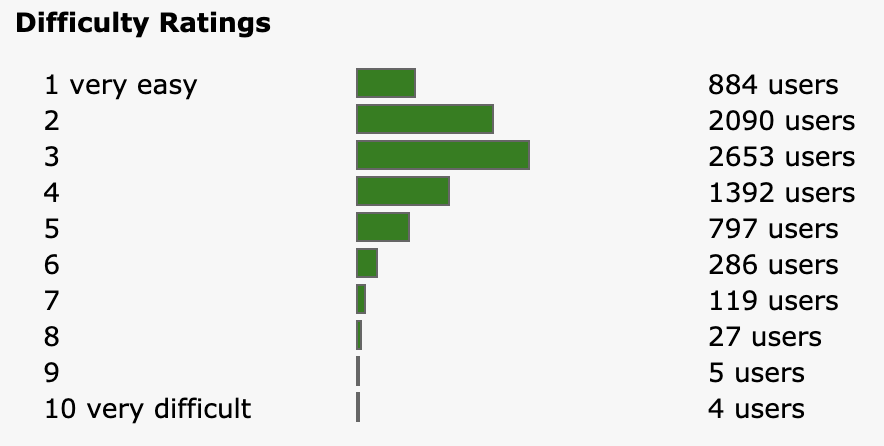
There is, however, a skew in the labels—most patterns fall between a 2 and a 4 on the difficulty scale.
The model
I tried a few different models and settled on a weighted linear regression model. Below, I’ve plotted my predicted difficulties vs. the difficulty labels of my test data set. The model is reasonably precise, with an rmse of about 1.
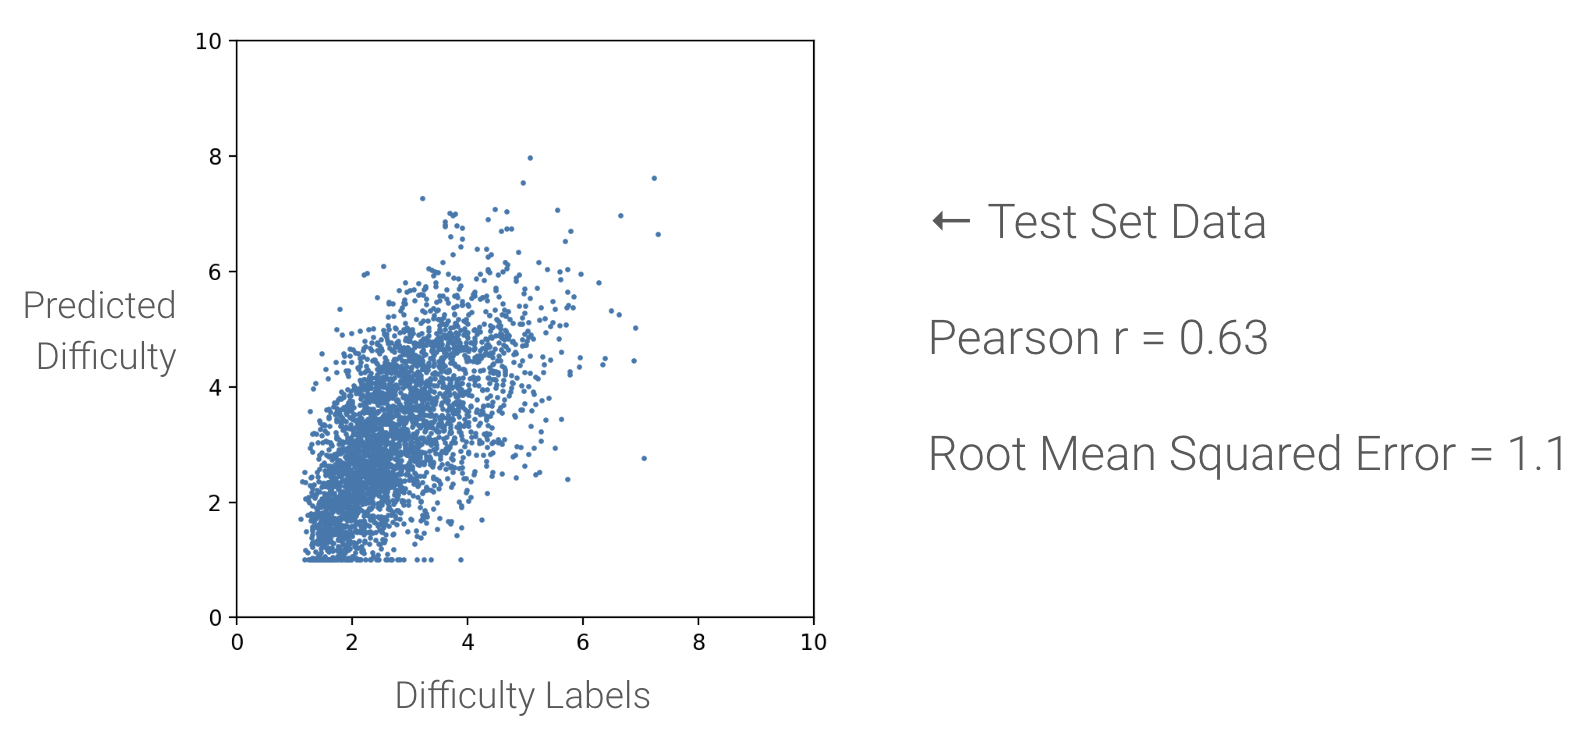
To get a measure of my model’s accuracy, I decided that a good prediction should fall within +- 1 difficulty point of the true label. That means that if we have a pattern with a true difficulty of 4, and we predict its difficulty at 3 (or 5), we consider that to be accurate enough. (After all, humans only agree on pattern difficulty to within +- 1.3 difficulty points.) 67% of the testing set predictions fell within that range.
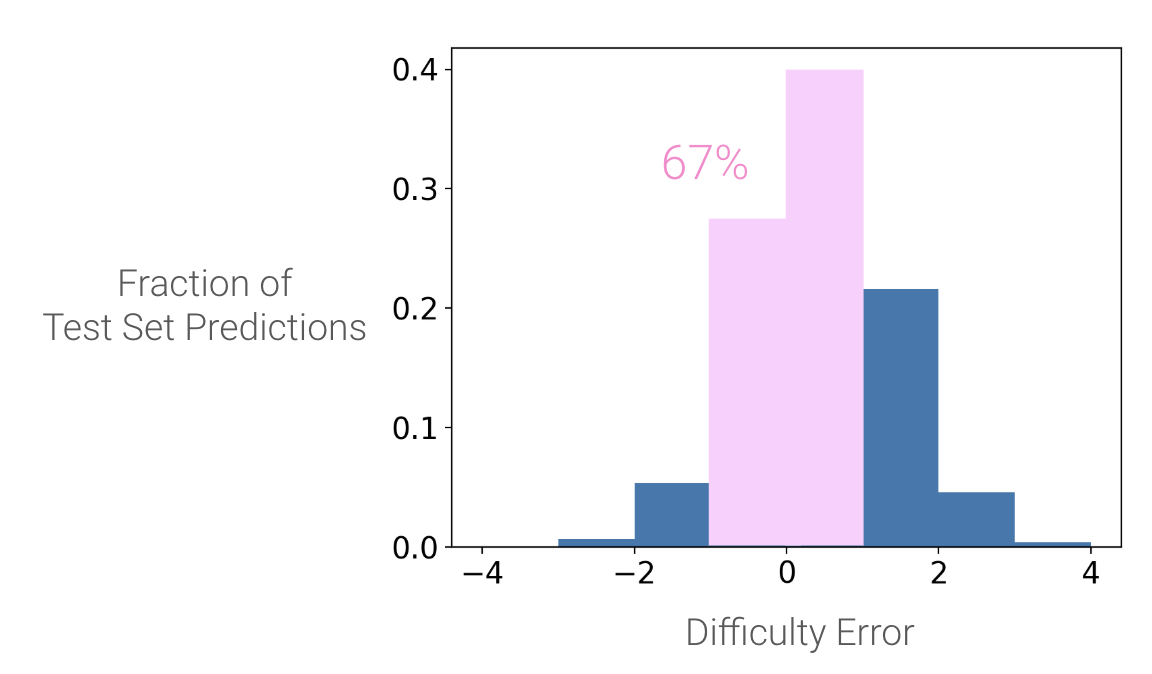
67% of predictions from my test data set fell within plus or minus 1 difficulty point of the pattern's true mean difficulty rating.
In addition to the difficulty rating, knitpicker uses feature importance to show which text tags were most and least predictive of difficulty. This offers a more personal experience–users can see what attributes and techniques are in this pattern, and use that information to decide whether this is a project they’re ready to tackle.
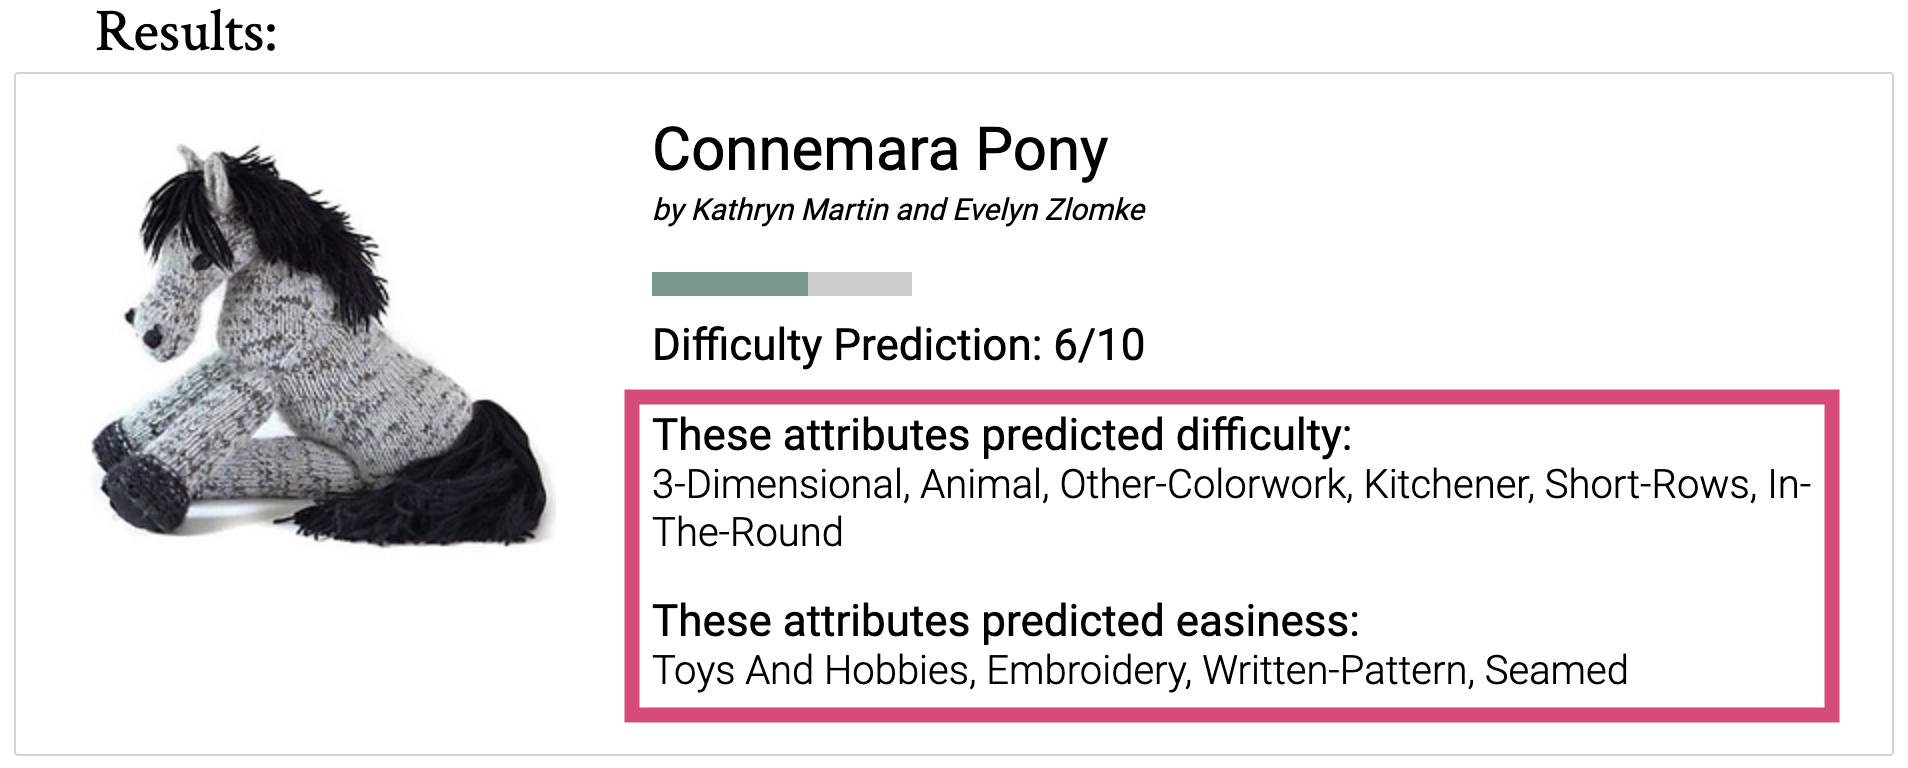
Knitpicker displays the attributes that are most and least predictive of pattern difficulty. For example, '3-Dimensional' and 'Animal' are common attributes of amigurumi patterns, which can be quite difficult. In contrast, 'Toys and Hobbies' is a very general category that can apply to a lot of different pattern types, which is likely why it is predictive of easiness.
Why weighted linear regression?
I started out with a standard linear regression model, but noticed that the model was under-predicting difficulty for the more difficult patterns—patterns that were actually a 5 or 6 were being predicted at 3 or 4. This phenomenon is caused by the hard cutoff of the 1 to 10 difficulty scale—if there was no cutoff, then we would have some outlier difficulty values above 10 to balance out any lower outliers. But with the hard cutoff, there are no high outliers, so any low outliers tend to drag the prediction values down. The finite difficulty scale breaks the normality assumption of linear regression.
Even though the unweighted linear regression model has reasonable accuracy overall, the bias towards predicting lower difficulties on high-difficutly patterns is really bad for users—if you’re a new knitter and you think something is a 3, but turns out to actually be a 5, you’re probably going to get discouraged. And since knitpicker is the most useful for the newest users, I decided that this bias was unacceptable.
To fix the bias, I added weights equal to the inverse of the number of difficulty values in each integer bin. For example, if a training example pattern was a difficulty 5.3, and there were 1000 training examples with an average difficulty between 5.0 and 6.0, then I set the weight of that training example to 1/1000. In my training examples, difficulty values between 2 and 4 were the most common, so these training examples got lower weights than the rarer 5+ difficulty examples.
The weights are put into the linear regression error function like this:
![]()
where y represents the data points, y-hat represents the predictions, and w represents the weights.
Training examples with a higher weight get more importance assigned to their error value—the model tries harder to minimize the errors of the more heavily weighted higher-difficulty patterns, and this results in the model skewing the difficulty predictions up a little bit. This weigheted linear regression model tends to over-predict—a pattern that is actually a 3 might be predicted as a 5.
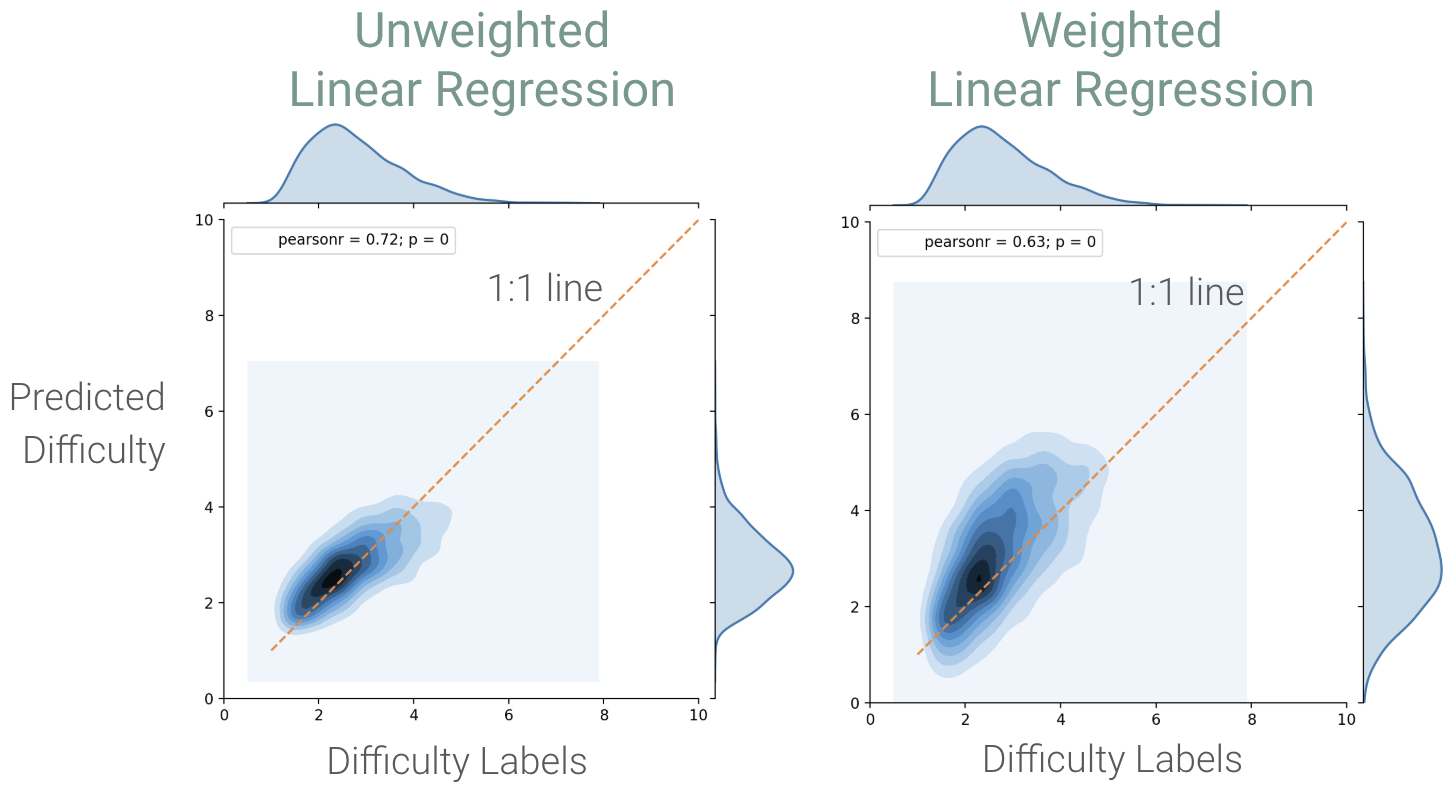
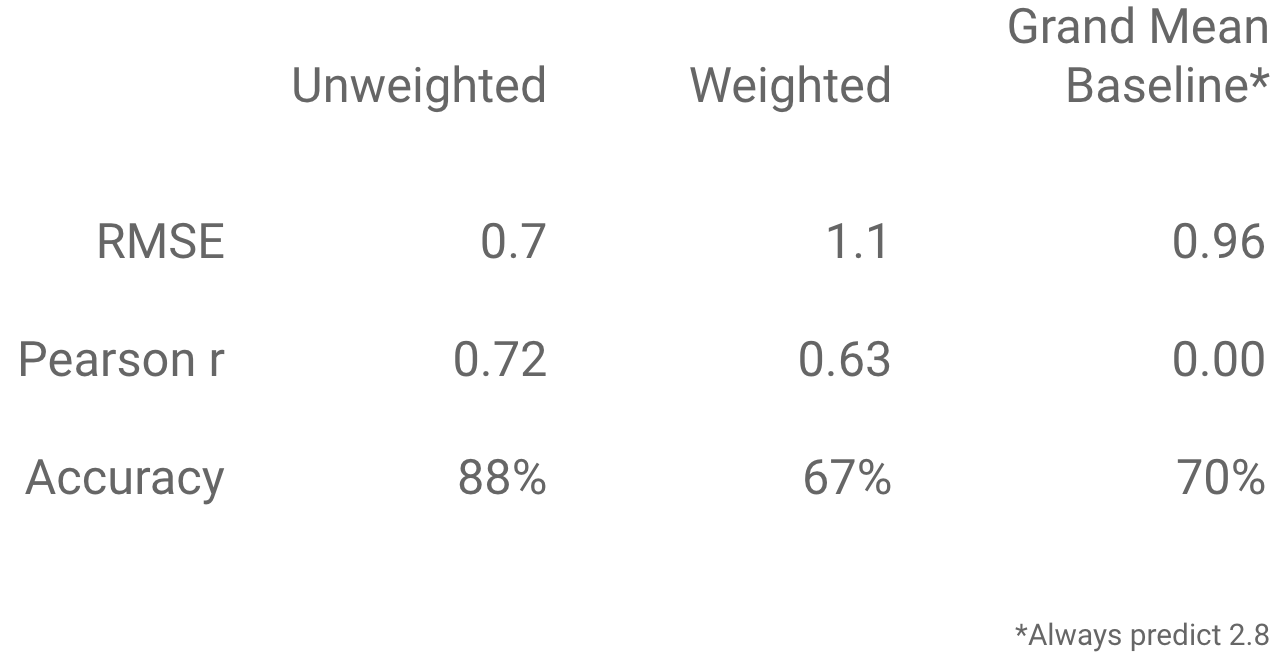
The unweighted linear regression model under-predicts difficulty, especially for high-difficulty patterns. The weighted linear regression model over-predicts pattern difficulty, which makes users less likely to be misled into trying a pattern that is more difficult than they expected, and provides a better experience for users.
The accuracy, correlation, and prediction spread of the weighted model are all a little worse than the unweighted model, but I believe the weighted model provides a better experience for users.
I also tried out some tree models, but didn’t see an improvement in prediction accuracy, so I stuck with the simpler linear model. This was a little surprising to me, as I thought that maybe a tree model would pick up nonlinear relationships between the text tags, for example maybe ‘lace’ and ‘colorwork’ aren’t too difficult on their own, but when combined they increase the difficulty a lot.
Where the model fails
The worst over-prediction errors in the test set were +4, and the worst under-prediction error was -4.
I’m not sure why users considered the Cthuluclava to be a difficulty 7—maybe the pattern instructions were poorly written, or maybe the pattern is cursed…
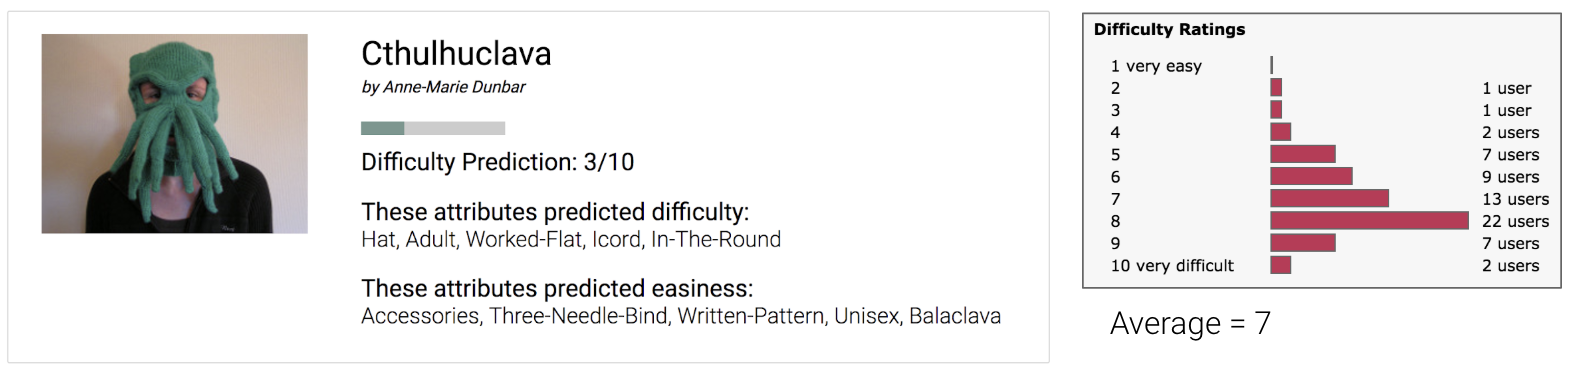
The worst under-prediction error in the test set was the Cthuluclava---the average human difficulty rating was 7, but the model predicted a difficulty of 3, producing an error of -4.
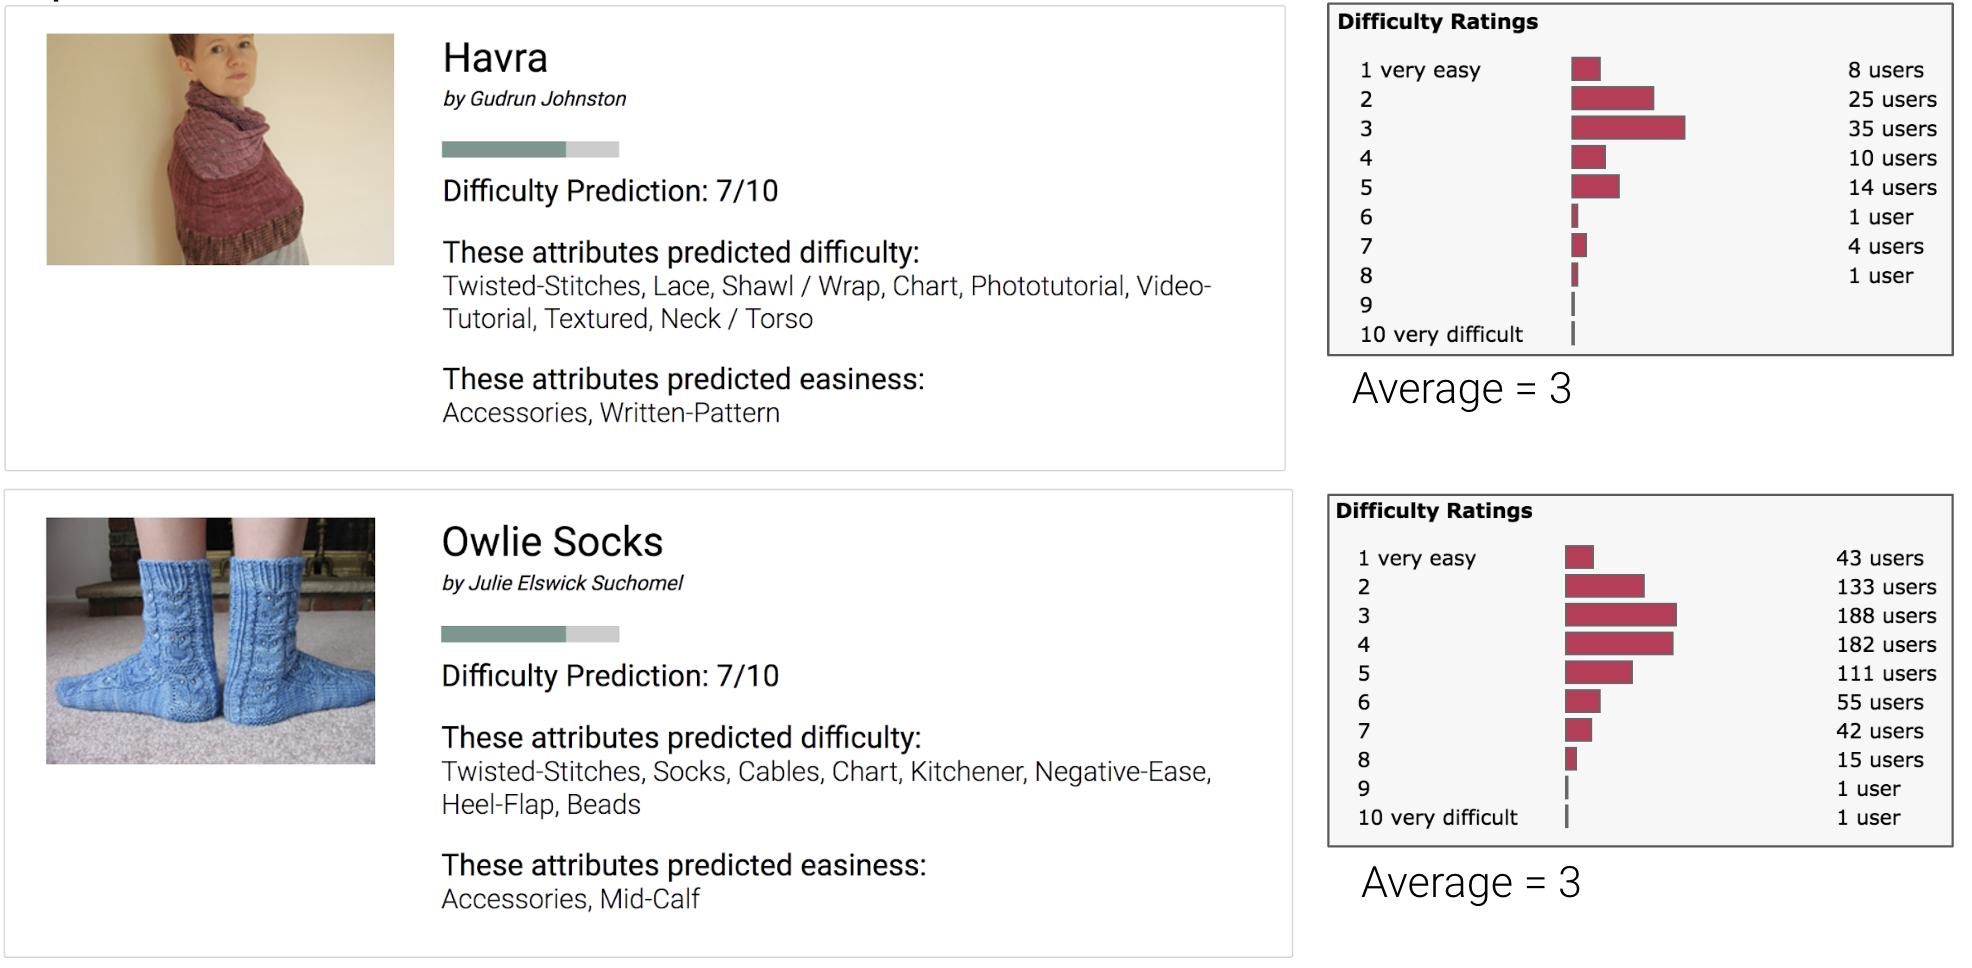
Sock and shawl patterns together make up of 62% of over-predictions greater than 3.
I hypothesized that maybe as a sock or shawl pattern gets more popular, the users would come from wider experience level ranges, and therefore the user rated difficulty of the pattern might increase as number of ratings increases. However, I don’t see this trend.
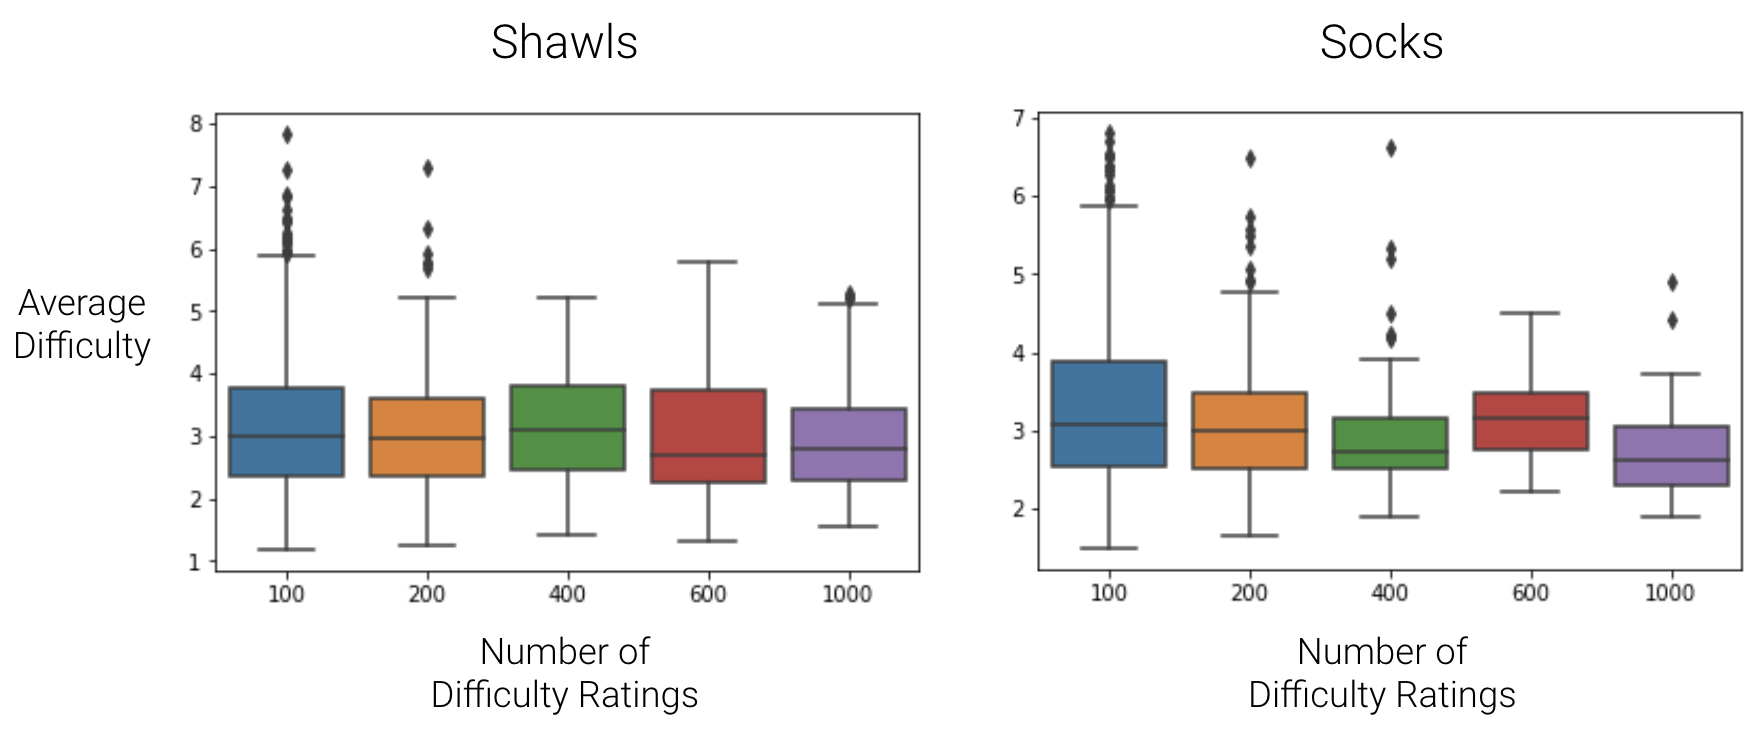
Average difficulty of sock and shawl patterns does not increase as a pattern gets more popular and receives more difficulty ratings.
Another hypothesis is that maybe sock and shawl patterns are only being worked by people who are used to making socks and shawls—maybe these knitters compare difficulty mainly to other sock and shawl patterns, and therefore skew the ratings.
Future work
Ravelry patterns also have user reviews, which contain rich text information about pattern difficulty. A promising next step would be to do sentiment analysis on those reviews, and perhaps compress that into another feature for the model. (These text reviews are more difficult to scrape from the website, which is why I didn’t include them in this iteration.)
Conclusion
I built Knitpicker to fill an information gap for Ravelry users. Before knitpicker, fewer than 20% of Ravelry patterns had reliable difficulty ratings. But knitpicker provides 100% of Ravelry patterns with useful difficulty information.
Knitpicker can prevent user frustration, drive pattern sales, and most importantly, help recruit more people to the wonderful craft of knitting!